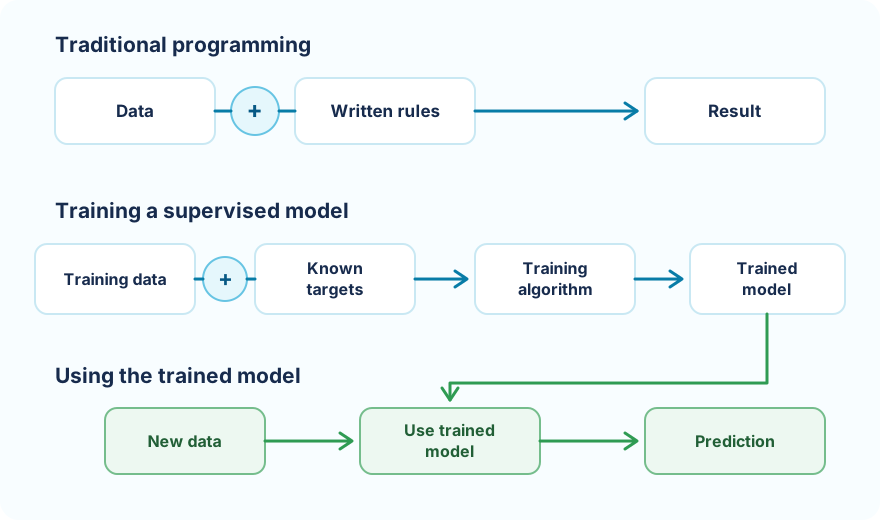
Machine Learning is a way of building software that learns patterns from examples instead of relying only on rules written by a developer.
In traditional programming, you provide data and explicit rules. In supervised Machine Learning, you provide data together with known results, and a training algorithm uses those examples to create a model. The trained model can then make predictions for new data:
A dataset contains samples. Each sample represents one observation, such as one computer or one email.
The input values that describe a sample are called features. The value that the model should learn to predict is called the target.
For example, a computer-performance dataset may contain:
Features: MYCT, MMIN, MMAX, CACH, CHMIN, CHMAX
Target:   PRP
One row is one computer. Its hardware properties are the features, while its published relative performance (PRP) is the target.
An email dataset may contain:
Features: num_links, num_words, has_offer, sender_score, all_caps
Target:   is_spam
Here, one row represents one email. The model uses the five features to predict whether that email is spam.
Regression predicts a numerical value. The result can take many possible values rather than belonging to a fixed category.
The number of input features and the relationship in the data determine which regression model fits the problem. Compare the examples below.
| Approach | Example | Features | Target | Walkthrough |
|---|---|---|---|---|
| Simple linear regression | Sorting Execution Time | Comparison count | execution_time_ms |
View example → |
| Multiple linear regression | Computer Hardware Performance | Six hardware characteristics | PRP |
View example → |
| Simple linear regression | Insurance Payment Prediction | Normalized claim count | total payment |
View example → |
| Nonlinear regression | House Price Prediction | Prepared LSTAT data | MEDV |
View example → |
Classification predicts which category a sample belongs to.
The target may contain two classes, several classes, or categories inferred from image pixels. Compare the common patterns below.
| Approach | Example | Features | Target | Classes | Walkthrough |
|---|---|---|---|---|---|
| Binary classification | Email Spam Detection | Email and sender characteristics | is_spam | NOT SPAMSPAM |
View example → |
| Logistic regression | Sonar Rock or Mine | 60 numerical sonar-signal values | Binary label | ROCKMINE |
View example → |
| Multiclass classification | Iris Flower Classification | Four flower measurements | Species (one-hot) | SETOSAVERSICOLORVIRGINICA |
View example → |
| Binary classification | Credit Card Fraud Detection | 29 numerical transaction features | Class | LEGITIMATEFRAUD |
View example → |
| Convolutional network | Hot Dog Detection | RGB image pixels | Image label | HOT DOGNOT HOT DOG |
View example → |
| Convolutional network | Duke Logo Recognition | RGB image pixels | Image label | DUKENEGATIVE |
View example → |
| Convolutional network | Parking Lot Occupancy | RGB image pixels | Image label | BUSYNEGATIVE |
View example → |
The target determines the type of supervised learning problem:
| Target | Problem type | Example prediction |
|---|---|---|
| Continuous numerical value | Regression | 347.25 |
| One of a fixed set of classes | Classification | SPAM |
| One of three or more classes | Multiclass classification | SETOSA |
A useful first question for any Machine Learning project is therefore:
What exactly should the model predict?
If the answer is a quantity, the problem is usually regression. If the answer is a category, the problem is classification.
A model must learn from one group of samples and be evaluated on different samples. This separation checks whether it learned a reusable pattern instead of memorizing the examples it already saw.
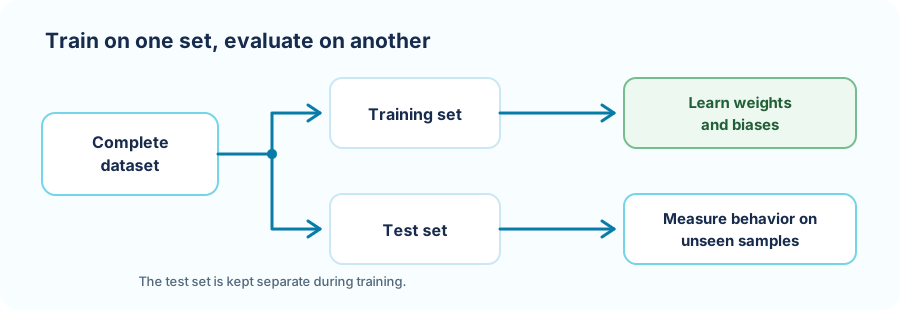
An 80/20 train/test split is a common starting point, although the right proportion depends on dataset size. The important rule is that the test set must not participate in training or in fitting preprocessing values.
When a model performs very well on training data but poorly on unseen data, it is overfitting. When it performs poorly even on training data, it is usually underfitting and may need better features, more training, or a more suitable architecture.
Evaluation translates model behavior into measurements. A single metric rarely tells the complete story, so choose metrics that match the task and the cost of different mistakes.
| Metric | What it measures | Better result |
|---|---|---|
| Mean Absolute Error (MAE) | Average absolute prediction error | Lower |
| Mean Squared Error (MSE) | Average squared error, with more emphasis on large misses | Lower |
| Root Mean Squared Error (RMSE) | Square root of MSE, on the target's general scale | Lower |
| R-squared (R²) | Improvement over always predicting the target mean | Usually closer to 1 |
MSE can be written as:
MSE = sum((actual - predicted)^2) / number of samples
Because the errors are squared, one large error influences MSE more strongly than several small errors.
A binary classifier produces four possible outcomes:
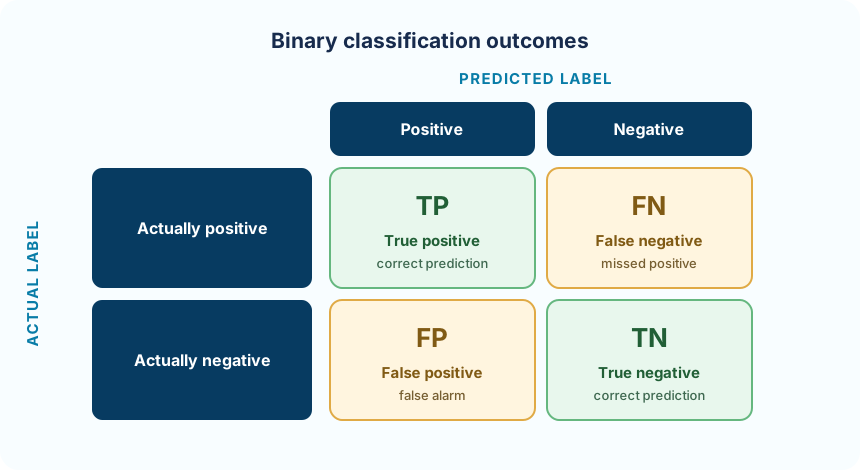
These counts form a confusion matrix and support several metrics:
accuracy  = (TP + TN) / all predictions
precision = TP / (TP + FP)
recall    = TP / (TP + FN)
F1        = 2 * precision * recall / (precision + recall)
Always interpret these values in the context of the application rather than choosing a model only because one number is largest.
| Term | Meaning |
|---|---|
| Sample | One observation or dataset row |
| Feature | An input value describing a sample |
| Target | The value or class the model learns to predict |
| Model | A learned mapping from features to a prediction |
| Training | The process of learning the model from known examples |
| Prediction | The model output for new input data |
| Generalization | Useful performance on samples not seen during training |
| Overfitting | Strong training performance but weak unseen-data performance |
Build the simplest trainable model for predicting a continuous value.
Features are the values supplied to a model, while the target is the value or class the model learns to predict.
If the answer is a numerical quantity, the task is usually regression. If it is a category, the task is classification.
Was this helpful?
Thank you!